1. Seeing the Brain through the Eye: Multimodal Diagnostic Eye Biomarkers of Cognitive Impairment
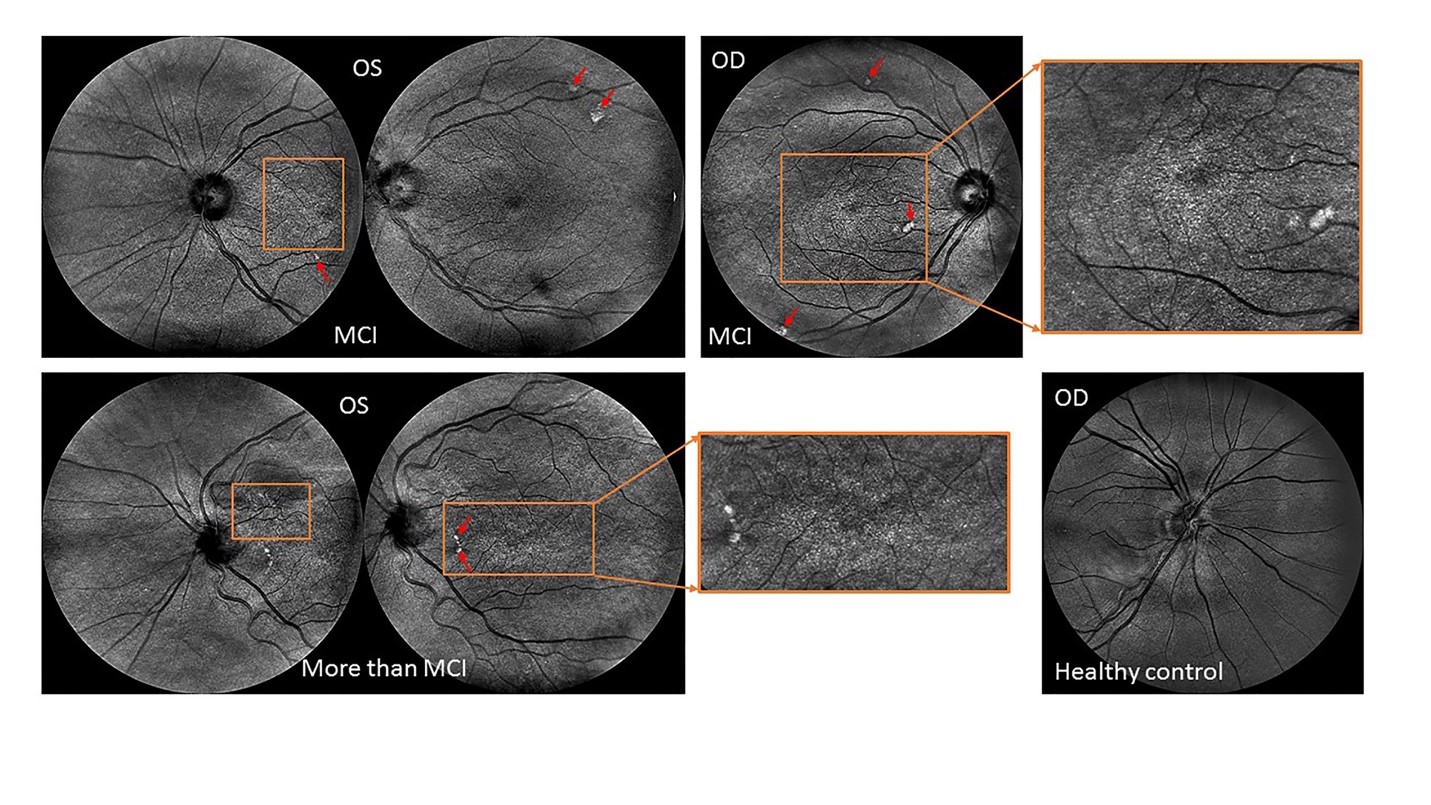
Aside from ophthalmic-image processing research, our group is also actively involved in the identification of novel ocular imaging biomarkers in neurodegenerative diseases of the central nervous system such as multiple sclerosis, Alzheimer and Parkinson’s diseases. Particularly, preliminary results from our most recent research on Alzheimer’s disease (AD) sponsored by the Finker Frenkel Legacy Foundation and the Alzheimer’s Association, is revealing that potential biomarkers of mild cognitive impairment could be identified by assessing their retinal vascular complexity and neurodegenerative changes with low-cost ophthalmic technologies (Fig.1). Our results also add support to the use of a multimodal diagnostic biomarker approach of cognitive impairment based on the retinal structure-function relationship which also has the advantage of requiring a low-cost implementation that can be used in community settings to detect cognitive decline-specific pathology in the retina, which could enable the early diagnosis and monitoring of disease progression. Provided a clinical correlation between the eye and brain measures can be confirmed, screening of eyes in people being considered at risk of cognitive impairment could help in the development of an alternative low-cost approach for early diagnosis as well as potentially serve to monitor the effectiveness of emerging therapies.
2. Quantitative assessment of early changes of diabetic retinal pathology
Another primary focus of our lab is to study the retinal microvasculature and structure using advanced optical imaging technologies. As a result, we have developed a computer-assisted diagnosis method for quantitative analysis of OCT images (OCTRIMA3D) from patients with diabetes mellitus and healthy subjects (Fig.2).
Our early work demonstrated that local changes in the diabetic retina could be used as surrogates for the subsequent progress of retinopathy inducing visual defects. For example, our initial research sponsored by the Juvenile Diabetes Research Foundation has demonstrated that changes in the ganglion cell complex might be the first indication of retinal neurodegeneration in patients with diabetes (cross-sectional studies). Moreover, we have introduced a methodological framework based on feature segmentation, machine learning and chaos theory for analyzing and classifying anatomical or pathological features of interest in ocular images captured with advanced optical imaging modalities. Also, ongoing research in the laboratory, initially funded by an NIH/NEI award, is currently addressing whether retinal neurodegeneration may be a primary pathology that gives rise to microvascular changes in the diabetic eye. Our long-term goal is to improve the early diagnosis and treatment of diabetic retinopathy.

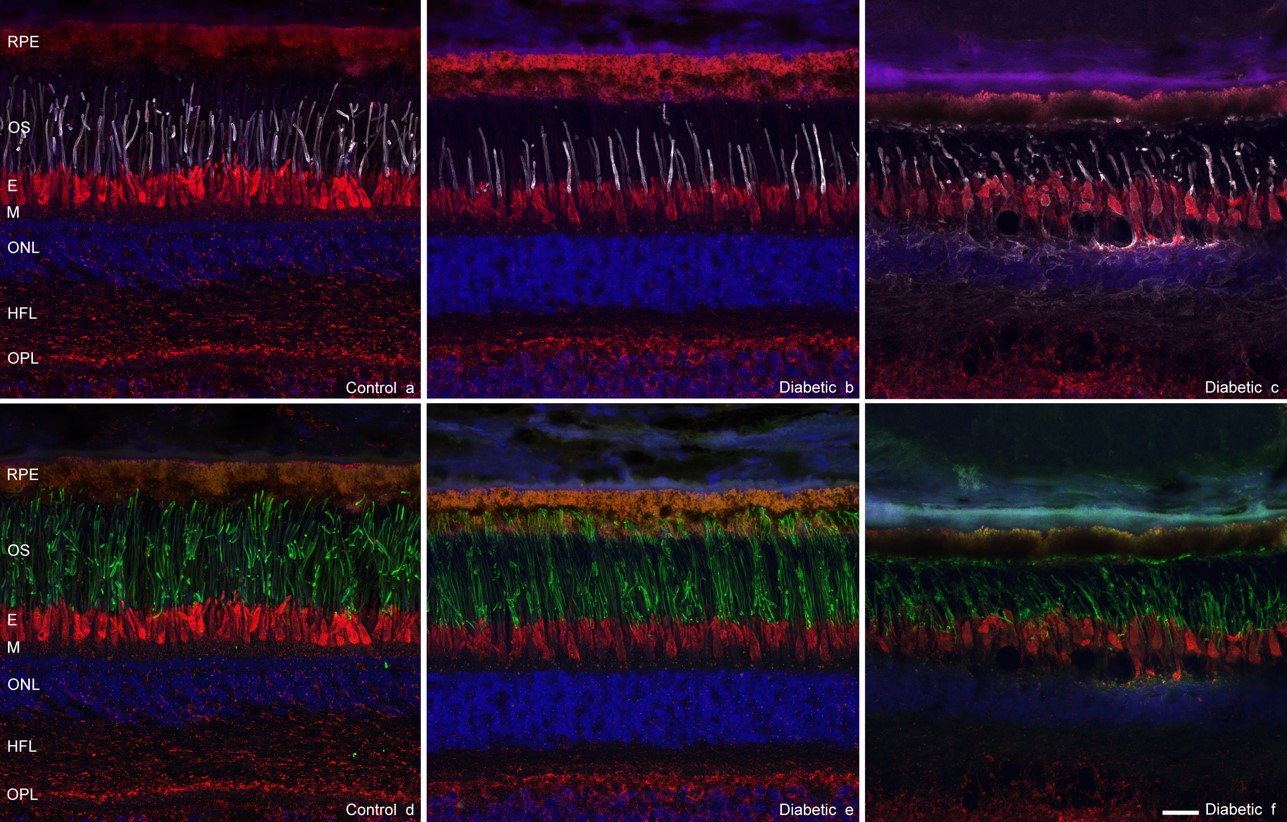
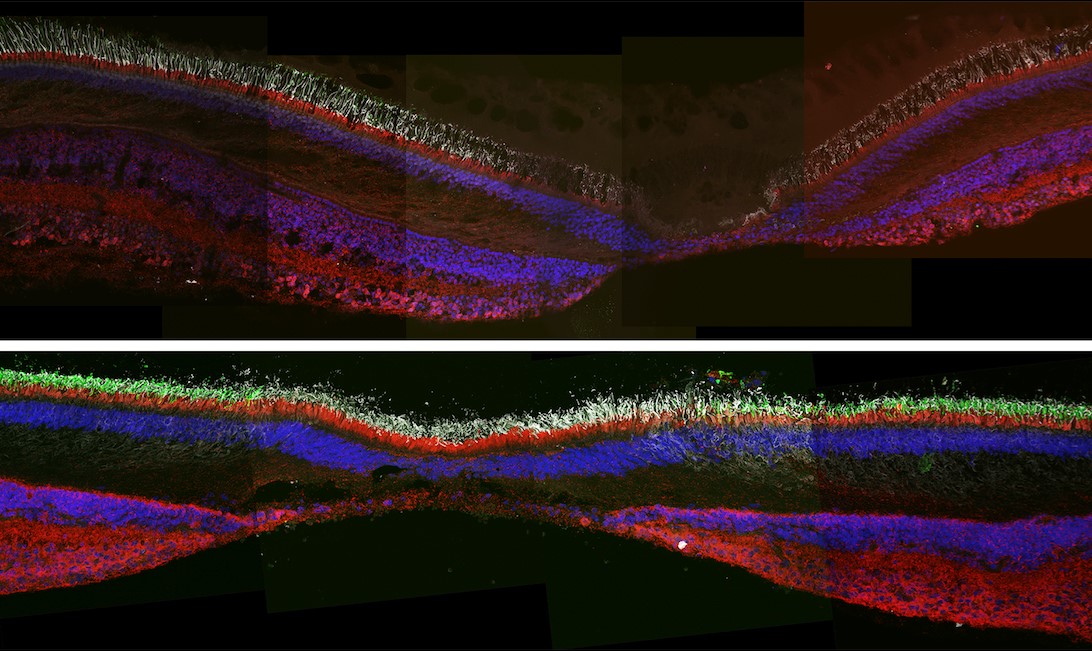
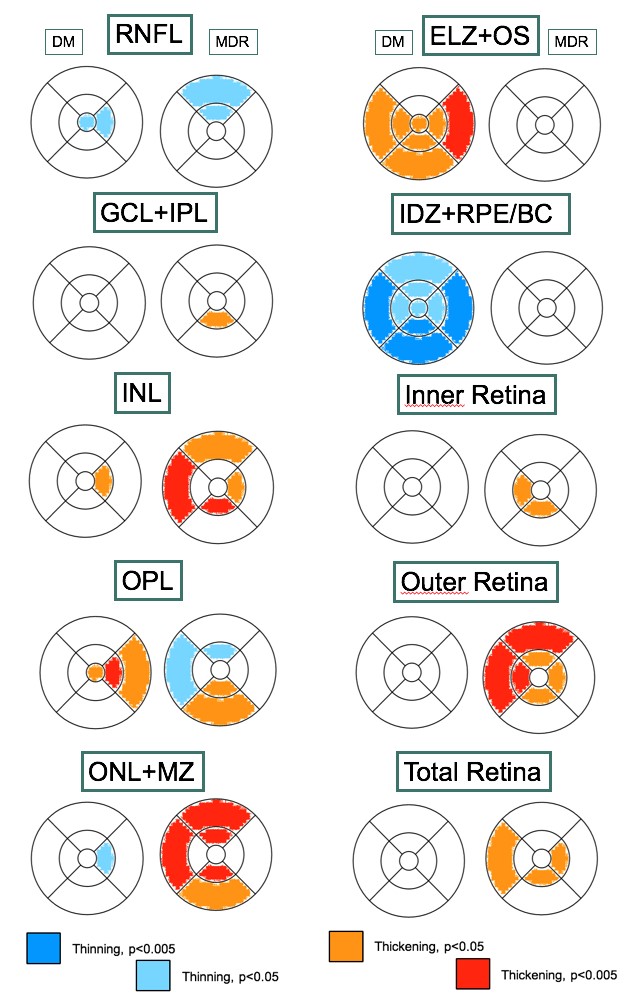
3. Advanced imaging for diabetic retinopathy (AIDR) study
Advances in preventing vision loss in diabetic patients are hindered by limited understanding of mechanisms underlying diabetic retinopathy (DR) and the altered relationships between the retinal neural tissue and retinal vasculature. Therefore, an objective test for the early diagnosis and evaluation of DR treatment is certainly needed in order to identify the individuals at great risk for vision-threatening problems. Studies have shown that, in DR, retinal neurodegeneration may be a primary pathology that gives rise to microvascular changes. While most studies have tried to explain the visual dysfunction in DR by focusing on the retinal vasculature changes, the potential contribution of photoreceptor cells which account for most of the mass and metabolic activity of the retina has been largely ignored.
We are studying the retinal microvasculature and structure using advanced optical imaging technologies. Our most recent results (longitudinal studies) have revealed that the outer retina may play an essential role in the neurodegeneration observed at the early stage of retinopathy even before the ganglion cells are lost (Figs. 3, 4 & 5). Our long-term goal is to prevent visual loss in diabetic patients based on a better understanding of the underlying mechanisms and the altered relationships between the neural retina and blood vessels.